
Page 13 - BrandZ Top 100 Most Valuable Chinese Brands 2015
P. 13
26
27
Part1 | Introduction-Overview
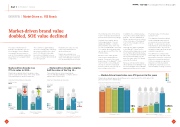
OVERVIEW | Market-Driven vs. SOE Brands
Market-driven brand value doubled, SOE value declined
TOP 100 Most Valuable Chinese Brands 2015
The value of market-driven brands in the BrandZTM Top 100 Most Valuable Chinese Brands increased 97 percent year-on- year, as China rebalanced and the government encouraged market competition.
The ecommerce giant Alibaba, whose IPO (Initial Public Offering) raised a record $25 billion, drove much of that brand value gain. Even without Alibaba, however, the value of market-driven brands rose 43.5 percent.
Meanwhile, the value of SOEs (State Owned Enterprises) declined 9 percent.
Market-driven brands now comprise 47 percent of the total value of the BrandZTM China Top 100, up from 29 percent in 2014.
The SOE proportion of the China Top 100 total value declined to 53 percent from 71 percent a year ago.
Similarly, three market-driven technology brands – Tencent, Alibaba and Baidu – comprise almost half the value of the Top 10. In the 2014 BrandZTM China Top 100, market-driven brands made up only about one-fifth of the Top 10 brand value.
Because of the value growth
of these three market-driven brands, 70 percent of the total brand value of the BrandZTM China Top 100 2015 is concentrated in the Top 10, which increased 28 percent year-on-year. The Top 10 also includes seven SOEs.
In addition, the combined value of just these three market-driven brands – Tencent, Alibaba and Baidu – produced over one-third of the total value of the BrandZTM Top 100 Most Valuable Chinese Brands 2015.
Although the debut of Alibaba
in the BrandZTM China Top 100 influenced the sharp year-on-year rise in market-driven brand value, the value of market-driven brands has increased steadily over the past five years, while SOE brand value has fluctuated.
Between 2011 and 2015, market- driven brands in the BrandZTM Top 50 Most Valuable Chinese Brands appreciated 278 percent in value.
The brand value of SOEs grew just 6 percent.
This disparity illustrates a global trend reshaping many national economies as some technology brands – social networks, device manufacturers, and software and network providers – become as valuable as large cap financial and industrial corporations.
The difference in China is that these large cap corporations are government owned or controlled. Within this ownership structure, SOEs increasingly recognize the imperative of effective brand building for sustained success in China’s rapidly evolving economy.
Market-driven brands rose 97% in value in 2015...
Market-driven brands almost doubled in value year-on-year, while the value of the SOEs (State Owned Enterprises) declined 9 percent.
China Top 100 Brand Value by Ownership
... Market-driven brands comprise half the value of the Top 10...
Three market-driven technology brands – Tencent, Alibaba and Baidu – comprise almost half the value of the Top 10.
... Market-driven brand value rose 278 percent in five years
Market-driven brands appreciated 278 percent in value from 2011 to 2015, while SOEs grew just 6 percent in brand value.
2011 2012 2013 2014 2015 (US$ Mil.)
2015 Total Value
464,234
2014 Total Value
379,787
268,958
2015 Top 10 Total Value 322,916
2014 Top 10 Total Value 252,653
2014
2015
% Share of Value
(US$ Mil.)
China Top 50 Brand Value by Ownership
2014
2015
% Share of Value
(US$ Mil.)
53,865
21%
+6%
54,923
66,778 77,864
+278%
71%
198,787
79% 166,257
51%
SOE Brands in Top 10
156,658
49%
SOEs 45 Brands
Market-Driven Brands 55 Brands
Market-Driven Brands in Top 10
SOE Brands in Top 50
Market-Driven Brands in Top 50
-9%
245,506
53%
+97%
218,728
47%
110,828
29%
258,591
242,360
263,435
236,361
China Top 10 Brand Value by Ownership
Source: BrandZTM / Millward Brown
Source: BrandZTM / Millward Brown
223,926
99,027
207,400
