
Page 22 - BrandZ Top 100 Most Valuable Chinese Brands 2015
P. 22
44
Figures are from the World Bank for 2013 and pertain to Mainland China unless otherwise noted 1China Internet Network Information Center (CNNIC) as of June 2014
2CIA World Fact Book 2014 estimate
45
Part1 | Introduction-Background
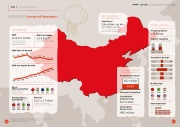
BACKGROUND | Economy and Demographics
TOP 100 Most Valuable Chinese Brands 2015
ECONOMY
GDP
US$ 9.2 Trillion
(Just over half the US GDP and three times larger than Japan’s)
GDP Rate of Growth
11.3% 12.7% 14.2%
GEOGRAPHY
Land Area 2
9.6 million sq. km.
(3.7 million sq. mi.)
(World’s fourth largest nation, slightly smaller than the US)
POPULATION
Total Population
1.35 billion
Urban Population
(percentage of total population)
53% 29%
1993 2013
Population by Age 2
25-54 47.2% YEARS
10.1%
9.6% 9.2% 2007 2008 2009
10.4% 9.3%
2010 2011
2004 2005 2006
2012
2013
$6,807
65 Plus YEARS
GDP Per Capita Growth
9.4% 55-64 11.3%
$1,490
$1,731
2004 2005
2008 2009
2010 2011
2012 2013
Brazil US
14.8% 13.5%
Gross
National Saving2 (2013 - saving as a percent of GDP)
Foreign Direct Investment (2013)
China India EU
China
$347.8 Billion
US
$235.9 Billion
Brazil
$80.8 Billion
Russia
$70.7 Billion
Exports2
US$ 2.2 Trillion
(Number one worldwide, followed by the EU and the US)
Passenger Cars
(per 1,000 people)
$2,069 $2,651
2006 2007
$3,414 $3,749 $4,433
50%
33.7% 19.2%
36.7yrs 30.7yrs 37.6yrs 38.7yrs
27yrs 40.4yrs
GDP Per Capita
US$ 6,807
(Around the same as Iraq)
$5,447 $6,093
CONNECTIVITY
Total Internet Users1 632 million
46.9%
Internet Penetration1 Total Mobile
Internet Users1 527 million
Total Smart Phone Users1
480 million
15-24 YEARS
0-14 YEARS
Median Age 2 (2014 estimate)
14.7% 17.1%
7.7% 7.7%
YEARS
2000 2011
7
54
